In February of 2010, Ben Bernanke began his second term as Chairman of the Board of Governors of the Federal Reserve System. That same year he said: "I wish I'd been omniscient and seen the crisis coming" (referring to the recession he predicted would not occur).
We all wish we could predict the future, and for more than ten years PointClear has compared lead rates to the GDP in hopes of finding a way to predict future lead rates and, maybe, the GDP. It would be cool if we could do both, but as you will see it appears that lead rates are the result of GDP, not the other way around. Here are the results for Q1, 2001 through Q2, 2012:
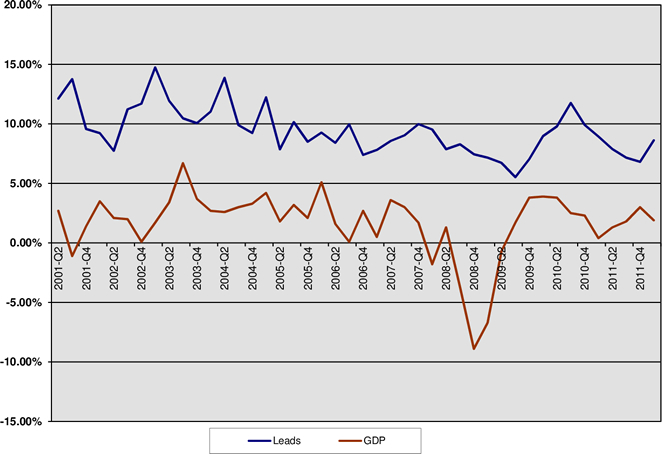
The numbers say the following to me:
- Leads trend in the direction of GDP. When the GDP is up, the lead rate increases, and vice-versa.
- Lead rates trail the GDP by about a quarter. So, companies can use GDP to anticipate changes in lead rates which could affect quotas and revenue projections.
- Overall lead rates trended down in 2002 and from 2008 – Q3 2009—yep, just as the economy did.
- Lead rates never dropped to zero. There are always companies outperforming the overall economy.
We expect lead rates to trend down over the next two quarters (Q3 and Q4 of 2012), but not below about 7% (a relatively healthy lead rate over the past four years). So those companies capable of accurate segmentation, with savvy media strategies, on-target messaging and spot-on execution (including those companies that are clients of PointClear), can expect to stay ahead of the pack over the next six months.
The lead rate we track against GDP includes short- and long-term leads. It is interesting to note that when GDP goes down, long-term lead rates sink while short-term lead rates more or less hold their own. During a downturn, companies fulfill short-term needs at about the same rate as normal economic conditions but do less long-term planning. Understanding this can help you pinpoint your marketing investments and generate better than average results. For example, you would expect companies to invest less in long-term marketing such as branding and more in demand generation from now until the end of 2012.
We publish this information quarterly and you can view the current Lead/GDP Chart anytime.
I am anxious to hear your thoughts.
By Dan McDade
Topics: Lead Generation, Marketing Strategy